iAnnotateSV package
Required Packages
We require that you install:
| pandas: | v0.16.2 |
|---|---|
| biopython: | v1.65 |
| Pillow: | v3.4.2 |
| reportlab: | v3.3.0 |
| coloredlogs: | v5.2 |
Quick Usage
If you know python I have created a small test script in /iAnnotateSV/test directory it runs a test on existing code and compares the result with the output file.
- Else To Run:
- If you want to run with default options:
python iAnnotateSV.py -i svFile.txt -ofp outputfilePrefix -o /path/to/output/dir -r hg19 -d 3000- If you want to run with your own transcripts:
python iAnnotateSV.py -i svFile.txt -ofp outputfilePrefix -o /path/to/output/dir -r hg19 -d 3000 -c canonicalTranscripts.txt- If you want to run with your own transcripts & make plots:
python iAnnotateSV.py -i svFile.txt -ofp outputfilePrefix -o /path/to/output/dir -r hg19 -d 3000 -c canonicalTranscripts.txt -u uniprot.txt -p
usage: iAnnotateSV.py [options]

**Annotate SV based on a specific human reference**

**optional arguments:**
    -h, --help            show this help message and exit
    -v, --verbose         make lots of noise [default]
    -r hg19, --refFileVersion hg19
                        Which human reference file to be used, hg18,hg19 or
                        hg38
    -ofp test, --outputFilePrefix test
                        Prefix for the output file
    -o /somedir, --outputDir /somedir
                        Full Path to the output dir
    -i svfile.txt, --svFile svfile.txt
                        Location of the structural variants file to annotate
    -d 3000, --distance 3000
                        Distance used to extend the promoter region
    -a, --autoSelect      Auto Select which transcript to be used[default]
    -c canonicalExons.txt, --canonicalTranscripts canonicalExons.txt
                        Location of canonical transcript list for each gene.
                        Use only if you want the output for specific
                        transcripts for each gene.
    -p, --plotSV          Plot the structural variant in question[default]
    -u uniprot.txt, --uniprotFile uniprot.txt
                        Location of UniProt list contain information for
                        protein domains. Use only if you want to plot the
                        structural variant
    -rr RepeatRegionFile.tsv, --repeatFile RepeatRegionFile.tsv
                        Location of the Repeat Region Bed File
    -dgv DGvFile.tsv, --dgvFile DGvFile.tsv
                        Location of the Database of Genomic Variants Bed File
    -cc CosmicConsensus.tsv, --cosmicConsensusFile CosmicConsensus.tsv
                        Location of the Cosmic Consensus TSV file
    -cct CosmicFusionCounts.tsv, --cosmicCountsFile CosmicConsensus.tsv
                        Location of the Cosmic Fusion Counts TSV file
Input file format is a tab-delimited file containing:
chr1 pos1 str1 chr2 pos2 str2
as the header and where:
- chr1: Its the chromosome name for first break point [1,2,3,4,5,6,7 etc..],
- pos1: Its the chromosome loaction for first break point [1-based],
- str1: Its the read direction for the first break point [0=top/plus/reference, 1=bottom/minus/complement],
- chr2: Its the chromosome name for second break point [1,2,3,4,5,6,7 etc..],
- pos2: Its the chromosome loaction for second break point [1-based],
- str2: Its the read direction for the second break point [0=top/plus/reference, 1=bottom/minus/complement],
Output file will is a tab-delimited file containing:
chr1 pos1 str1 chr2 pos2 str2 gene1 transcript1 site1 gene2 transcript2 site2 fusion
as the header and where:
- chr1 : Its the chromosome name for first break point [1,2,3,4,5,6,7 etc..],
- pos1 : Its the chromosome loaction for first break point [1-based],
- str1 : Its the read direction for the first break point [0=top/plus/reference, 1=bottom/minus/complement],
- chr2 : Its the chromosome name for second break point [1,2,3,4,5,6,7 etc..],
- pos2 : Its the chromosome loaction for second break point [1-based],
- str2 : Its the read direction for the second break point [0=top/plus/reference, 1=bottom/minus/complement],
- gene1 : Gene for the first break point,
- transcript1 : Transcript used for the first breakpoint,
- site1 : Explanation of the site where the first breakpoint occurs [Example=>Intron of EWSR1(+):126bp after exon 10],
- kinasedomain1 : Explanation of the site where the first breapoint involves a Kinase Domain or not[Example=>Partial Kinase Domain Included]
- gene2 : Gene for the second break point,
- transcript2 : Transcript used for the second breakpoint,
- site2 : Explanation of the site where the second breakpoint occurs [Example=>Intron of ERG(-):393bp after exon 4],
- kinasedomain2 : Explanation of the site where the second breapoint involves a Kinase Domain or not[Example=>Partial Kinase Domain Included]
- fusion : Explanation if the evnet leads to fusion or not. [Example=>Protein Fusion: in frame {EWSR1:ERG}]
- Cosmic_Fusion_Counts : Number of Counts for the Events from Cosmic Fusion Results
- repName-repClass-repFamily:-site1 : Repeat Region Annotation for site 1
- repName-repClass-repFamily:-site2 : Repeat Region Annotation for site 2
- CC_Chr_Band : Cosmic Cancer Census Chromosome Band
- CC_Tumour_Types(Somatic) : Cosmic Cancer Census Tumor Type in Somatic Samples
- CC_Cancer_Syndrome : Cosmic Cancer Census Cancer Syndrome the genes are related to.
- CC_Mutation_Type : Cosmic Cancer Census Mutation Types the Genes are related to.
- CC_Translocation_Partner : Cosmic Cancer Census Translocation Partners for the gene.
- DGv_Name-DGv_VarType-site1 : Database of Genomic Variants annotation for site 1
- DGv_Name-DGv_VarType-site : Database of Genomic Variants annotation for site 2
| Example Plot: | 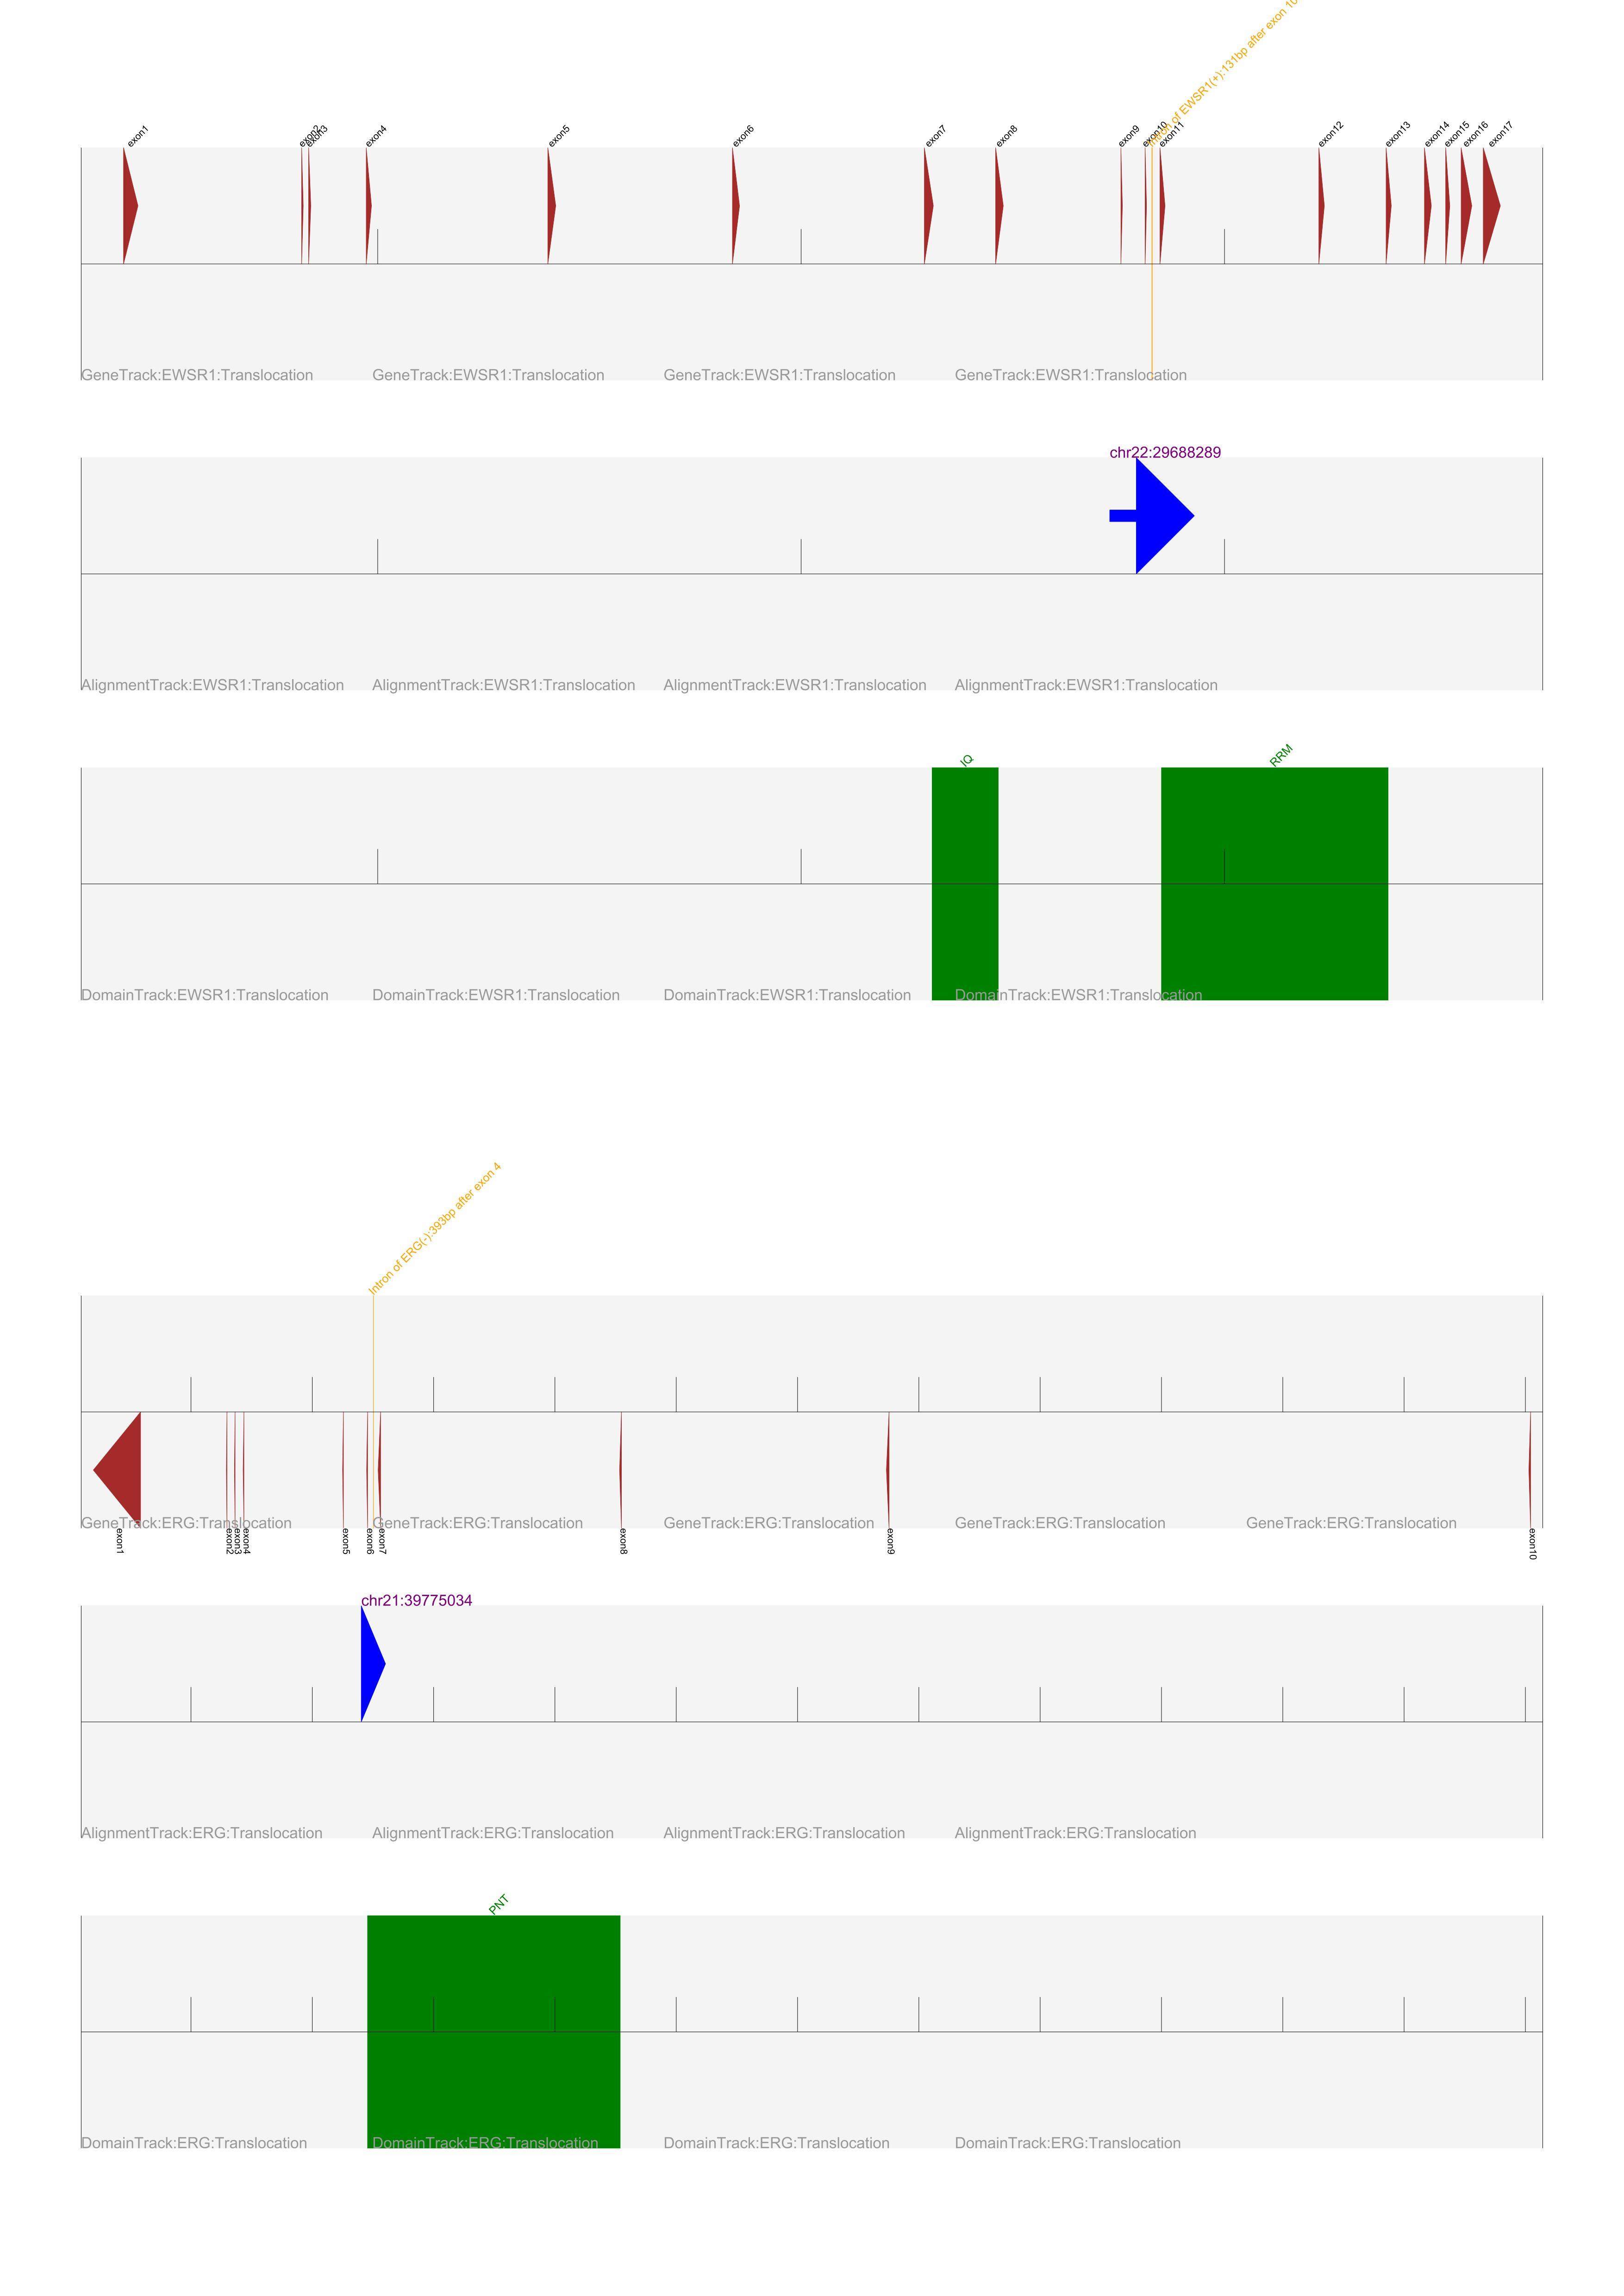
|
|---|
The above plot shows the following:
- There are three tracks for each break point. The first three tracks belong to breakpoint 1 and second three tracks belong to breakpoint 2.
- Thre three tracks are:
- Gene Model Track:
- Displays Exons as brown and there direction with exons in arrow formation.
- In orange it displays the breakpoint description.
- Alignment Track:
- Displays the direction of the reads for the breakpoint. Also displays the co-ordinate in Purple.
- Read in Positive direction are Blue and Negative direction are Red
- Protein Domain Track:
- Displays the Protein Domain as green boxes with there names in green.
Output file name for plot is Gene1-Chromosome1_Position1_Gene2-Chromosome2_Position2_EventType.jpg All the Outputs are written into a folder called iAnnotateSVplots in the given output directory
Please look at examples of input and output files in /data/test directory where: /data/test/testData.txt is the input file /data/test/testResult.txt is the output file
The refFileVersion are automaticslly chosen from /data/references. But caution this is only tested on hg19. All these files are created using UCSC table browser.
The example for canonical transcripts can be also found in /data/canonicalInfo. In general the file is tab-delimited containing:
Gene Transcripts
as the headers where:
- Gene : Gene symobol should match the gene name from /data/references file.
- Transcripts : Transcripts is a particular transcript that you are interested in using instead of auto-selection.
The file for hg19 uniprot is created using UCSC table browser (Uniprot spAnnot track). The file for hg19 is in /data/UcscUniprotdomainInfo
Module iAnnotateSV contents
Submodules
AnnotateEachBreakpoint module
- This module will annotate each breakpoint taking in:
- chr : chromosome for the event,
- pos : position in the chromosome for the event,
- str : direction of the reads for the event[either 0 or 1],
- referenceDataframe : a pandas data-frame that will store reference information
Example: AnnotateEachBreakpoint(chr1,pos1,str1,refDF)
FindATranscript module
- This module will automatically find the highest preference transcript based on input:
- queryDF : Its a dataframe with
- c = zone: 1=exon, 2=intron, 3=3’-UTR, 4=5’-UTR, 5=promoter
- d,e = for exons: which one, and how far
- d1,d2,e1,e2 = for introns: between which exons and how far?
- f = for introns: how many bases in the partially completed codon?,
- referenceDataframe : a pandas data-frame that will store reference information
Example: FindATranscript(queryDF,refDF)
FindAllTranscripts module
- This module will find all transcripts based on input:
- queryDF : Its a dataframe with
- c = zone: 1=exon, 2=intron, 3=3’-UTR, 4=5’-UTR, 5=promoter
- d,e = for exons: which one, and how far
- d1,d2,e1,e2 = for introns: between which exons and how far?
- f = for introns: how many bases in the partially completed codon?,
- referenceDataframe : a pandas data-frame that will store reference information
Example: FindAllTranscripts(queryDF,refDF)
FindCanonicalTranscript module
- This module will Finad a canonical transcript based on the input for main function and output of FindAllTranscripts:
- geneList : List of genes [this will normally be list with same names] for the Structural Variant in question,
- transcriptList : List of transcripts for the Structural Variant in question,
- siteList : direction of the site for the event[either 0 or 1],
- zoneList : different zones in which the event can occur [zone: 1=exon, 2=intron, 3=3’-UTR, 4=5’-UTR, 5=promoter]
- strandList : direction of the read for the event[either 0 or 1],
- intronnumList : Which intron the event occurs if the event is in intron for each transcript,
- intronframeList : What is the frame of the intron where the event is occuring for each transcript.
- ctDict : a dictionary containing the canonical transcript information for each gene. [Gene=>Transcript]
Example: FindCT(geneList,transcriptList,siteList,zoneList,strandList,intronnumList,intronframeList,ctDict)
PredictFunction module
This module will predict the function of each annotated breakpoint
- It takes two pandas series which has following information:
- gene : Gene for the event,
- transcript : Transcript used for the event,
- site : Explanation for site where the event occurs,
- zone : Where does the event occur [ 1=exon, 2=intron, 3=3’-UTR, 4=5’-UTR, 5=promoter ],
- strand : Direction of the transcript,
- str : Direction of the read,
- intronnum : Which intron the event occurs if the event is in intron,
- intronframe : What is the frame of the intron where the event is occuring.
Example: ann1S = pandas.Series([gene1,transcript1,site1,zone1,strand1,str1,intronnum1,intronframe1],index=['gene1', 'transcript1', 'site1', 'zone1', 'txstrand1', 'readstrand1', 'intronnum1','intronframe1'])ann2S = pandas.Series([gene2,transcript2,site2,zone2,strand2,str2,intronnum2,intronframe2],index=['gene2', 'transcript2', 'site2', 'zone2', 'txstrand2', 'readstrand2', 'intronnum2','intronframe2'])So ann1S & ann2S are series that will go to PredictFuntionForSV()
PredictFunctionForSV(ann1S,ann2S)
AddExternalAnnotations module
- This module will annotate each breakpoint for Repeat Region, Database of Genomic Variants and Cosmic Census taking in:
- repeat region file : Repeat Track from UCSC in tab-delimited format (see:
/data/repeat_region/hg19_repeatRegion.tsv), - data base of genimic variant file : DGv in tab-delimited format (see:
/data/database_of_genomic_variants/hg19_DGv_Annotation.tsv), - cosmic census file : cosmic census file from sanger (see:
/data/cosmic/cancer_gene_census.tsv), - cosmic fusion counts file : cosmic fusion counts file from from cosmic fusion export (see:
/data/cosmic/cosmic_fusion_counts.tsv), - structural variants file : File containing the breakpoint information,
- output prefix : Output Prefix for the output files (.xlsx,.json,.txt),
- output directory : Directory where the output needs to be written
Example: makeCommandLineForAEA = "-r " + repeatregionFilePath + " -d " + dgvFilePath + " -c " + ccFilePath + " -cct " + cctFilePath + " -s " + svFilePath + " -ofp AnnotatedSV" + " -o " + outputDirAddExternalAnnotations.main(makeCommandLineForAEA)- repeat region file : Repeat Track from UCSC in tab-delimited format (see:
AnnotateForRepeatRegion module
- This module has two submodules will read and annotate each breakpoint for Repeat Region
ReadRepeatFile
- This will read a tab-delimited file into a panadas dataframe
AnnotateRepeatRegion
- This is will annotate the breakpoints for repeat region.
Example: AnnotateRepeatRegion(verbose, count, svObject, repeatregionDict)
AnnotateForDGv module
- This module has two submodules will read and annotate each breakpoint for Database of Genomic Variants
ReadDGv
- This will read a tab-delimited file into a panadas dataframe
AnnotateDGv
- This is will annotate the breakpoints for Database of Genomic Variants.
Example: AnnotateDGv(verbose, count, svObject, dgvDict)
AnnotateForCosmic module
This module will annotate each breakpoint for Cosmic Census
Example: AnnotateFromCosmicCensusFile(comic_census_filename, verbose, count, svObject)Example: AnnotateFromComicFusionCountsFile(comic_fusion_counts_filename, verbose, count, svObject)
helper module
- This module has multiple submodules
- ReadFile()
- This will read a tab-delimited file into a panadas dataframe
- ExtendPromoterRegion()
- This will extend the promoter region to a given length
- bp2str()
- This will convert base pair information to string information
- ReadFile()
VisualizeSV module
- This module will annotate each breakpoint taking in:
- svDataFrame : Annotated structurla varaints dataframe obtained from PredictFuntion Module,
- referenceDataFrame : a pandas data-frame that will store reference information,
- uniprotDataFrame : making a dataframe from the uniprot data.
- args : This has all the arguments that are generated from iAnnotateSV module
Example: VisualizeSV(svDataFrame,referenceDataFrame,uniprotDataFrame,args)Example Plot:
iAnnotateSV module
- This module is the driver module, it takes user information and runs all other module to produce proper structural variant annotation
usage: iAnnotateSV.py [options]**

Annotate SV based on a specific human reference**

optional arguments:**
-h, --help            show this help message and exit
-v, --verbose         make lots of noise [default]
-r hg19, --refFileVersion hg19
                        Which human reference file to be used, hg18,hg19 or
                        hg38
-ofp test, --outputFilePrefix test
                        Prefix for the output file
-o /somedir, --outputDir /somedir
                        Full Path to the output dir
-i svfile.txt, --svFile svfile.txt
                        Location of the structural variants file to annotate
-d 3000, --distance 3000
                        Distance used to extend the promoter region
-a, --autoSelect      Auto Select which transcript to be used[default]
-c canonicalExons.txt, --canonicalTranscripts canonicalExons.txt
                        Location of canonical transcript list for each gene.
                        Use only if you want the output for specific
                        transcripts for each gene.
-p, --plotSV          Plot the structural variant in question[default]
-u uniprot.txt, --uniprotFile uniprot.txt
                        Location of UniProt list contain information for
                        protein domains. Use only if you want to plot the
                        structural variant
-rr RepeatRegionFile.tsv, --repeatFile RepeatRegionFile.tsv
                        Location of the Repeat Region Bed File
-dgv DGvFile.tsv, --dgvFile DGvFile.tsv
                        Location of the Database of Genomic Variants Bed File
-cc CosmicConsensus.tsv, --cosmicConsensusFile CosmicConsensus.tsv
                        Location of the Cosmic Consensus TSV file
-cct CosmicFusionCounts.tsv, --cosmicCountsFile CosmicConsensus.tsv
                        Location of the Cosmic Fusion Counts TSV file